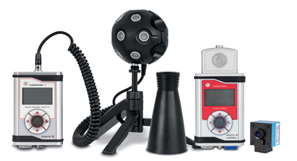
The Utragraphyx hardware consists of an ultrasonic generator, transducer, ultrasonic receiver, and industrial camera. The camera is mounted on a tripod overviewing the scene and connected to a laptop that runs the Ultragraphyx software.
The ultrasonic receiver has a wireless connection to the laptop via Bluetooth, the camera is connected with a USB cable.
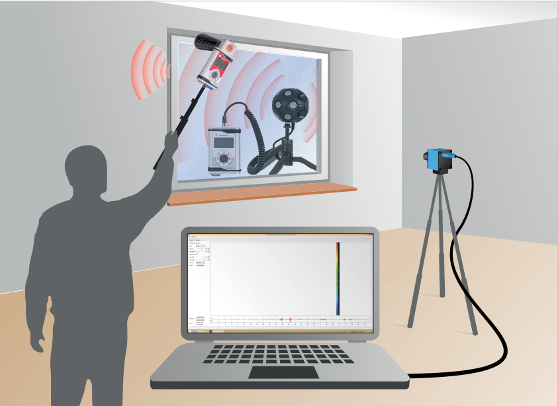
The ultrasonic transducer is placed on one side of the construction and on the other side the ultrasonic microphone is moved alongside the seams.
Once the measurement is started, the Ultragraphyx software tracks the microphone position in real time from the video stream and combines it with the measured sound intensity from the receiver.
The sound is inaudible. It's intensity is a measure for the amount of leakage through the seam.
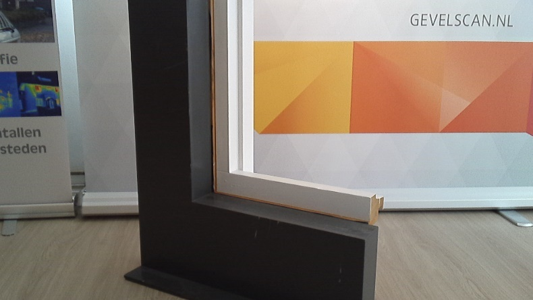
Example of an Ultragraphyx measurement
The test setup is an open window frame with an airtight seal to the construction that is damaged at one point.
A point transducer is used that is moved simultaneously with the receiver along the seams., the point transducer at one side and the receiver at the other side of the frame. Multiple passes are made over the seams, this allows the software to calculate an averaged sound intensity and improves the measurement quality.
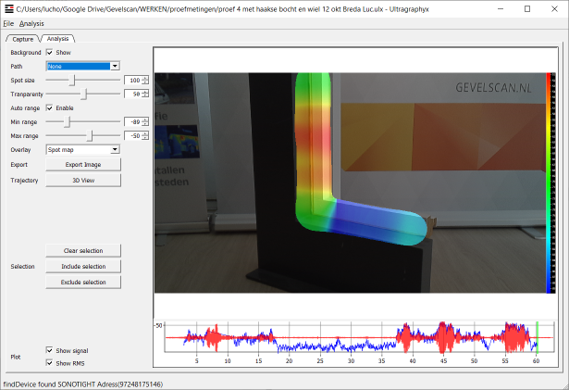
After the measurement, the result can be processed in the Ultragraphyx application.
At the bottom of the screenshot is the sound track with the measured ultrasonic sound intensity. Points are drawn on the image where the application detected the camera in the video stream. Each point combines a camera positions and sound intensity.
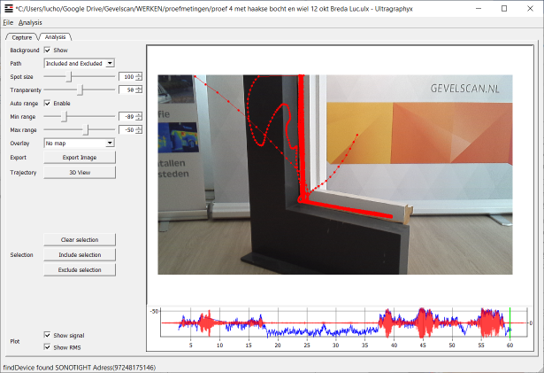
Points can be selected and excluded from the calculation. Excluded points are shown in blue.
Some points where captured when the user walked towards the frame and they are excluded.
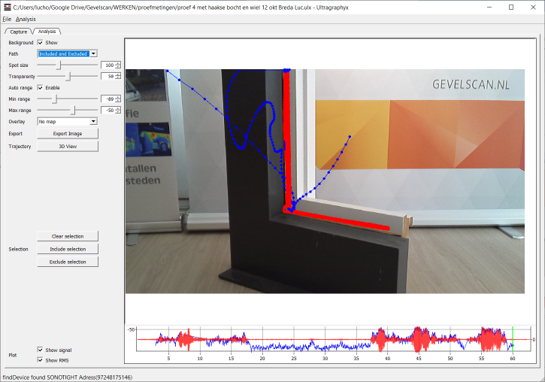
The application calculated the receiver position in three dimensions, and the distance to the object can be checked in a 3D view.

The resulting Ultragraphyx measurement picture. The image can now be exported for the report.
A transparent color image has been placed over the photo where the color corresponds to the measured sound intensity in dB. On the right a color bar with legend is inserted.